
Asia-Pacific’s high net worth individuals harder hit than global average. GENEVIEVE CUA reports
THE wealth of high net worth individuals (HNWIs) in the Asia-Pacific took a harder knock than the global average, falling below 2006 levels at end-2008. And while the sharp rebound in markets this year would have restored some of this wealth, it is estimated that aggregate wealth is still about 25 per cent below the peak in 2007.
 |
But the ultra HNWI segment suffered an even bigger dent in wealth and numbers. This segment is defined by Merrill Lynch and Capgemini as people with investible assets of at least US$30 million excluding their home.
Based on data crunched by Merrill Lynch and Capgemini, the region’s HNWI population fell 14.2 per cent to 2.4 million individuals, compared with a global drop of 14.9 per cent. This segment has investible wealth of at least US$1 million. But in terms of the value of assets, HNWI wealth in the Asia-Pacific sank 22.3 per cent to US$7.4 trillion, below the 2006 level of US$8.4 trillion. Aggregate HNWI wealth hit US$9.5 trillion in 2007.
The number of ultra-HNWIs plunged 29.6 per cent in the Asia-Pacific, compared to a fall of 24.6 per cent globally. And the value of their assets fell 35 per cent, compared to the global average decline of 24 per cent.
Kong Eng Huat, Merrill Lynch Global Wealth Management’s head of South Asia advisory, said: ‘Asian investors are more aggressive in their profiles and tend to allocate to volatile assets. In a down market, their wealth tends to drop more.’
As for the ultra HNWI segment, he said their exposure to ‘more aggressive products and higher leverage’ accounted for some of the damage. The average ultra HNWI holds an estimated US$120 million in assets.
A case in point was businessman Oei Hong Leong, who said he lost $1 billion on margin trading. His lawsuit against Citibank was settled recently for an undisclosed sum.
Singapore’s HNWI population has fallen 21.6 per cent to 61,000, from 78,000 in 2007. Aggregate wealth fell to 29.4 per cent to US$272 billion. Singapore’s average HNWI has US$4.4 million in net investible assets, down from US$4.9 million in 2007. The region’s average HNWI wealth was estimated at about US$3.1 million in 2008.
Hong Kong’s HNWI segment suffered the sharpest drop, as its ranks thinned 61 per cent to 37,000 and aggregate wealth shrank 65 per cent to US$181 billion.
Outlook still bright
Still, the outlook for wealth in the region remains bright as Asian economies are expected to grow at a faster pace than the global economy. China and India, in particular, are expected to lead the charge, as more individuals join the HNW ranks, buoyed by strong domestic consumption. The wealth of HNWIs in India and China is forecast to burgeon by over US$4 trillion over the next decade.
The combined wealth of the region’s HNWIs is estimated to grow 8.8 per cent a year until 2018, faster than the global average of 7.1 per cent.
‘We expect the Asia-Pacific to be a significant driver of global HNWI wealth,’ said Antony Hung, Merrill Lynch’s head of Asia-Pacific wealth management. ‘The region’s diverse economic landscape presents tremendous growth opportunities for wealth management firms.’
Asset allocation is becoming more conservative assets. Merrill Lynch research head (Singapore and Malaysia) Melvyn Boey said: ‘Because of market uncertainty and tighter credit, (Asian HNWIs) favour investments closer to home. We expect them to maintain a cautious approach, focusing on capital preservation and liquidity as prime objectives.’
Mr Kong said that while investors have begun to get into equities, the mood remains ‘very cautious’. ‘We’re also seeing more investments into fixed income.’
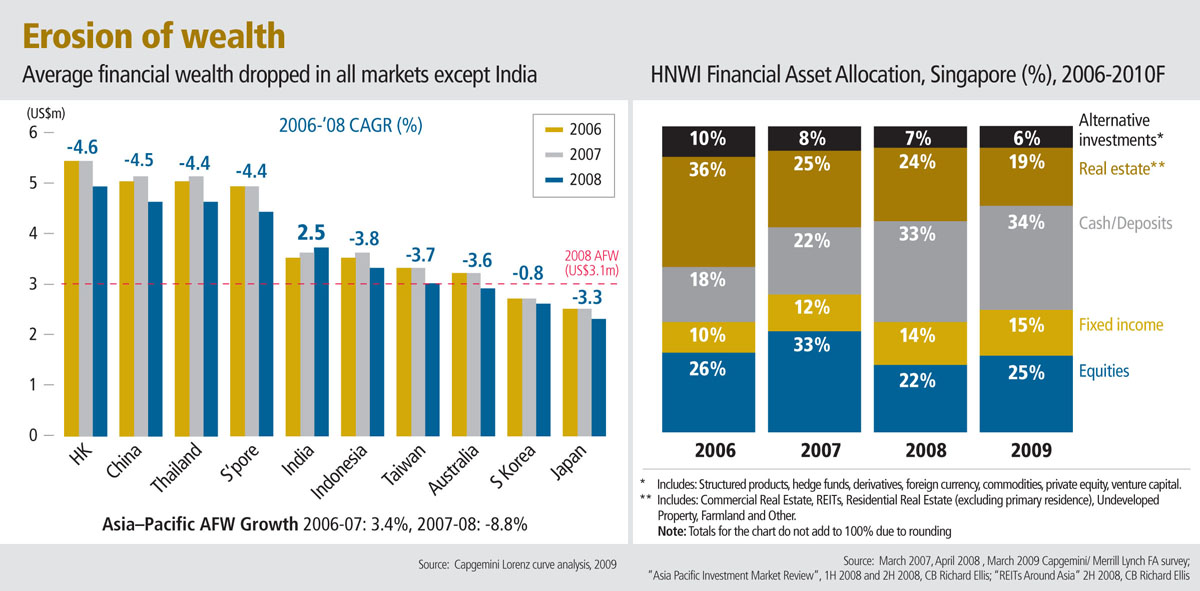
Singapore’s HNWIs held 33 per cent in cash and 14 per cent in fixed income, compared with the regional allocation of 29 per cent in cash and 20 per cent in fixed income. In terms of alternative investments – a 7 per cent allocation among Singapore millionaires – clients favoured foreign currency and structured products with capital protection. This allocation is expected to be shaved by one per cent in 2010 as clients seek ‘safer’ investments.
Singapore HNWI’s allocation of 24 per cent to real estate is higher than the regional average of 22 per cent. But it has fallen substantially from the 2006 allocation of 36 per cent. Merrill said HNWIs took profits from increased values in 2007 and shifted money into other asset classes.
Singaporeans’ allocation to real estate is forecast to fall further to 19 per cent by 2010 as investors are expected to be sidelined by market uncertainty and economic risks. Other investment opportunities may arise in other asset classes, diverting money away from property.
In terms of wealth managers, Capgemini Financial Services vice-president Bhalaji Raghavan said 42 per cent of advisers reported client attrition. ‘Trust was the key reason to move assets. Asia-Pacific advisers also did not have the experience to effectively deal with the crisis.’ Of the advisers that lost clients, 63 per cent operated on an individual model and 37 per cent had a team-based model.
Some 62 per cent of those who lost clients were less than 41 years old. The average years of experience among relationship managers in the region was 9.7 years, compared with the global average of 13.3 years.
Source : Business Times – 14 Oct 2009

